【比赛】Kaggle - G-Research Crypto Forecasting 【正在进行】
前期分析
需求分析
简述:预测14款比特币未来的趋势,七七八八弄了一个较为复杂的Target,内核就是预测趋势,准确来说,是未来加密货币的随着时间的价格变化率的近似,而评估指标是加权的皮尔逊相关系数。
Dataset Structure
train.csv - The training set
- timestamp - A timestamp for the minute covered by the row.
- Asset_ID - An ID code for the cryptoasset (加密资产).
- Count - The number of trades that took place this minute. 一分钟发生的交易数量。
- Open - The USD price at the beginning of the minute. 起始价
- High - The highest USD price during the minute. 最高价
- Low - The lowest USD price during the minute. 最低价
- Close - The USD price at the end of the minute. 结束价
- Volume - The number of cryptoasset u units traded during the minute. 分钟总交易额
- VWAP - The volume-weighted average price for the minute. 一分钟内的加权平均交易金额(单个货币)
- Target - 15 minute residualized returns. See the ‘Prediction and Evaluation section of this notebook for details of how the target is calculated.
- Weight - Weight, defined by the competition hosts here 每个交易资产的权重
- Asset_Name - Human readable Asset name.
example_test.csv - An example of the data that will be delivered by the time series API.
example_sample_submission.csv - An example of the data that will be delivered by the time series API. The data is just copied from train.csv.
asset_details.csv - Provides the real name and of the cryptoasset for each Asset_ID and the weight each cryptoasset receives in the metric.
supplemental_train.csv - After the submission period is over this file’s data will be replaced with cryptoasset prices from the submission period. In the Evaluation phase, the train, train supplement, and test set will be contiguous in time, apart from any missing data. The current copy, which is just filled approximately the right amount of data from train.csv is provided as a placeholder.
- 📌 There are 14 coins in the dataset
- 📌 There are 4 years in the [full] dataset
Baseline
- G-Research Crypto Forecasting | Kaggle ——GrandMaster分享。
- 教程 | Kaggle网站流量预测任务第一名解决方案:从模型到代码详解时序预测 - 云+社区 - 腾讯云 (tencent.com)
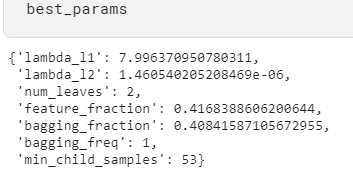
- [G-Research] Avoid Overfit: Feature Neutralization | Kaggle ——防止过拟合
- G-Research Crypto Forecasting | Kaggle ——相关案例分享
- Recreating Target | Kaggle —— 重建label
Competetion Target
监督学习,所需要预测目标——“Target”特征
- Target: Residual log-returns for the asset over a 15 minute horizon.
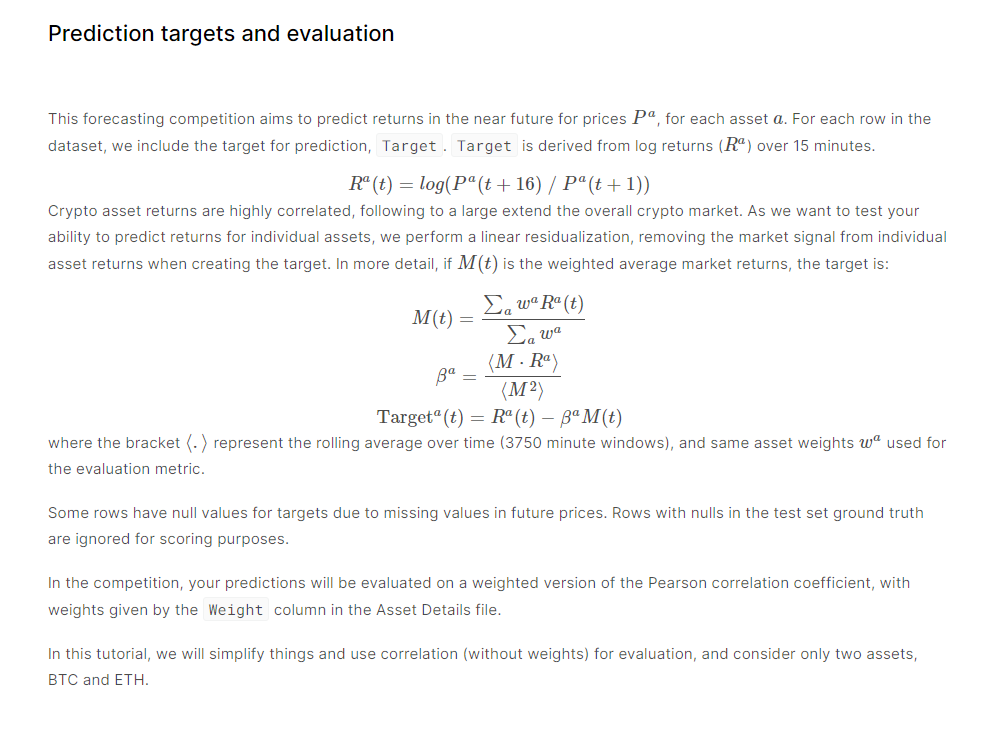
- 评价指标:Target的加权皮尔逊相关系数
1 | |
- 进一步分析,该分数重点可拆分为两点:
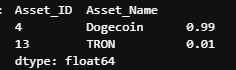
- 权重,由于是加权皮尔逊相关系数,那么权重更大的Target对相关系数的贡献越多
- 相关系数,也即比较的是相关性,是变化率之间的联系,相当于是时序之中的斜率,也即在未来时间段看涨还是看跌。
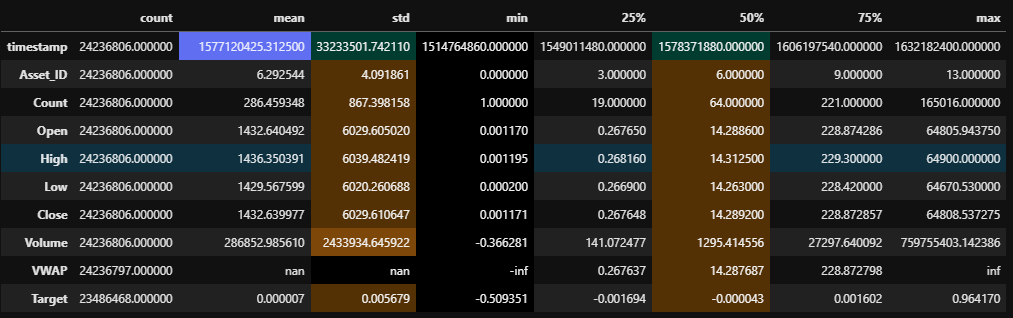
数据观测
- 先做大致的观测
1 | |
1 | |
1 | |
本博客所有文章除特别声明外,均采用 CC BY-SA 4.0 协议 ,转载请注明出处!